Part 1: Trigonometry
Angles
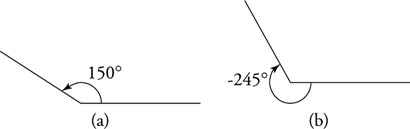
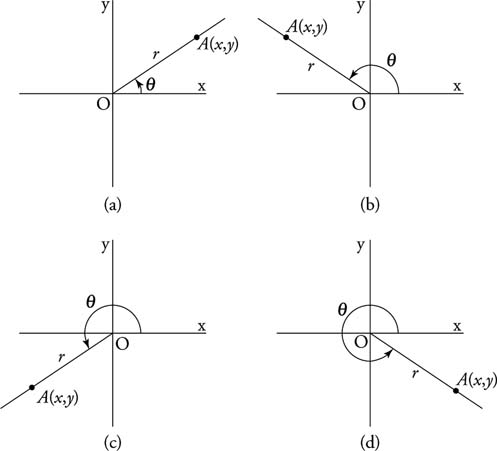
An angle is a measure of rotation. Angles are measured in degrees. One complete rotation is measured as 360°. Angle measure can be positive or negative, depending on the direction of rotation. The angle measure is the amount of rotation between the two rays forming the angle. Rotation is measured from the initial side to the terminal side of the angle. Positive angles (Figure 1 a) result from counterclockwise rotation, and negative angles (Figure 1 b) result from clockwise rotation. An angle with its initial side on the x-axis is said to be instandard position.
| |||
| |||
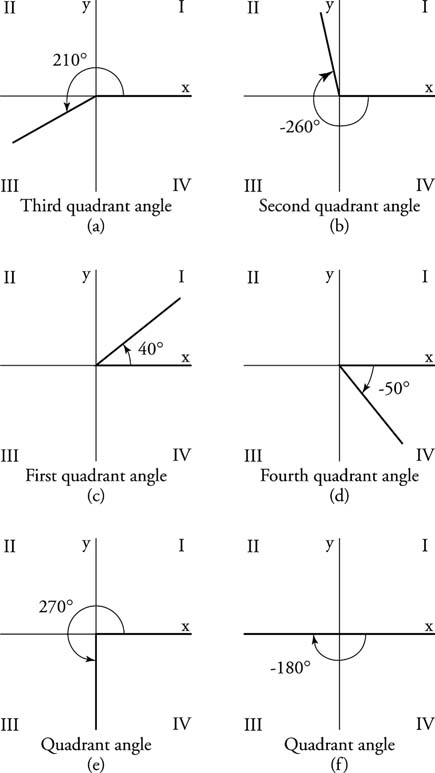
Angles that are in standard position are said to be quadrantal if their terminal side coincides with a coordinate axis. Angles in standard position that are not quadrantal fall in one of the four quadrants, as shown in Figure 2 .
| |||
| |||
|
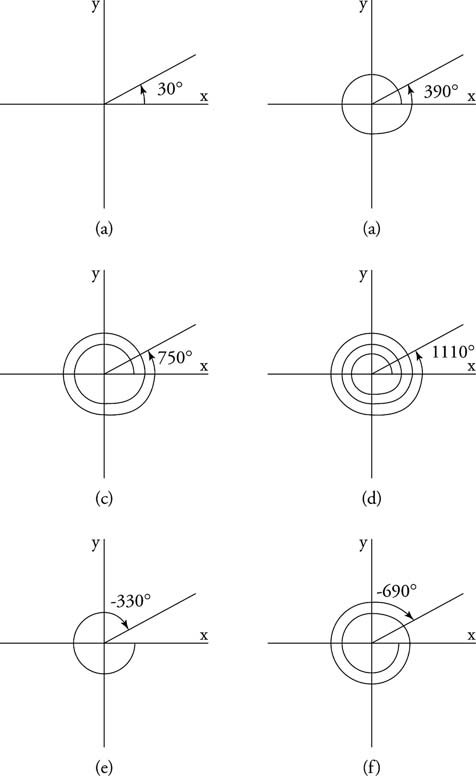
Two angles in standard position that share a common terminal side are said to be coterminal.The angles in Figure 3 are all coterminal with an angle that measures 30°.
| |||
| |||
|

|
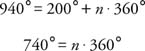
Because 740 is not a multiple of 360, these angles are not coterminal.
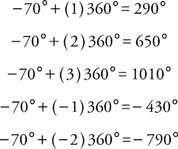
Example 3: Name 5 angles that are coterminal with −70°.
|
Angle measurements are not always whole numbers. Fractional degree measure can be expressed either as a decimal part of a degree, such as 34.25°, or by using standard divisions of a degree called minutes and seconds. The following relationships exist between degrees, minutes, and seconds:
|

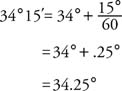
Example 4: Write 34°15′ using decimal degrees.
|
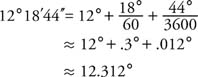
Example 5: Write 12°18′44″ using decimal degrees.
|
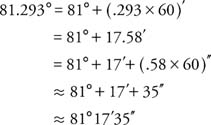
Example 6: Write 81.293° using degrees, minutes, and seconds.
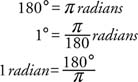
Angles can be measured in one of two units: degrees or radians. The relationship between these two measures may be expressed as follows:
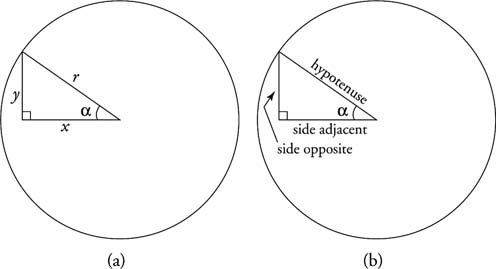
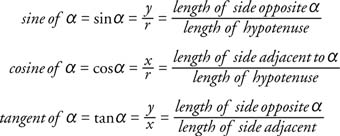
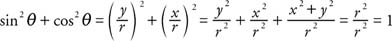
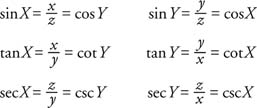
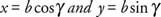
The following ratios are defined using a circle with the equation x2 + y2 = r2 and refer to Figure1 .
Remember, if the angles of a triangle remain the same, but the sides increase or decrease in length proportionally, these ratios remain the same. Therefore, trigonometric ratios in right triangles are dependent only on the size of the angles, not on the lengths of the sides. The cosecant, secant, and cotangent are trigonometric functions that are the reciprocals of the sine, cosine, and tangent, respectively.
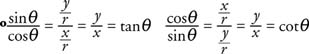
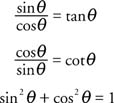
If trigonometric functions of an angle θ are combined in an equation and the equation is valid for all values of θ, then the equation is known as a trigonometric identity. Using the trigonometric ratios shown in the preceding equation, the following trigonometric identities can be constructed.
Symbolically, (sin α)2 and sin2 α can be used interchangeably. From Figure 1 (a) and the Pythagorean theorem, x2 + y2 = r2.
These three trigonometric identities are extremely important:
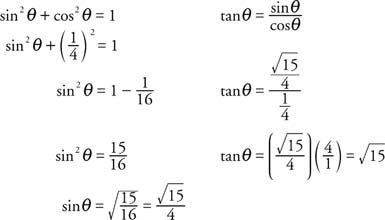
Example 1: Find sin θ and tan θ if θ is an acute angle (0° ≤ θ ≤ 90°) and cos θ = ¼.
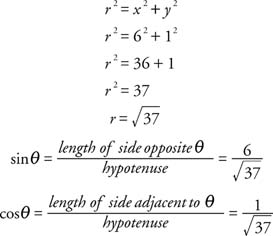
Example 2: Find sin θ and cos θ if θ is an acute angle (0° ≤ θ ≤ 90°) tan θ = 6. If the tangent of an angle is 6, then the ratio of the side opposite the angle and the side adjacent to the angle is 6. Because all right triangles with this ratio are similar, the hypotenuse can be found by choosing 1 and 6 as the values of the two legs of the right triangle and then applying the Pythagorean theorem.
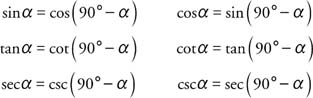
Trigonometric functions come in three pairs that are referred to as cofunctions. The sine and cosine are cofunctions. The tangent and cotangent are cofunctions. The secant and cosecant are cofunctions. From right triangle XYZ, the following identities can be derived:
|

| |||
| |||
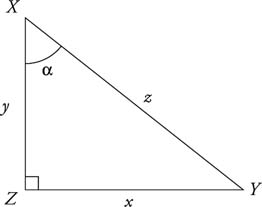
Thus, in general:
|
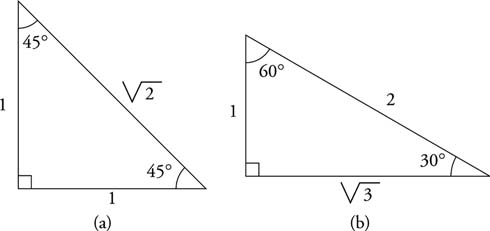
Example 3: What are the values of the six trigonometric functions for angles that measure 30°, 45°, and 60° (see Figure 3 and Table 1 ).
|

| |||
| |||
Functions of General Angles
Acute angles in standard position are all in the first quadrant, and all of their trigonometric functions exist and are positive in value. This is not necessarily true of angles in general. Some of the six trigonometric functions of quadrantal angles are undefined, and some of the six trigonometric functions have negative values, depending on the size of the angle. Angles in standard position have their terminal side in or between one of the four quadrants. Figure 1shows a point A (x, y) located on the terminal side of angle θ with r as the distance AO. Note that r is always positive. Based on the figures,
|

| |||
| |||
Law of Cosines
|
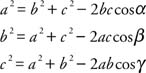
These three formulas are called the Law of Cosines. Each follows from the distance formula and is illustrated in Figure 1 .
| |||
| |||
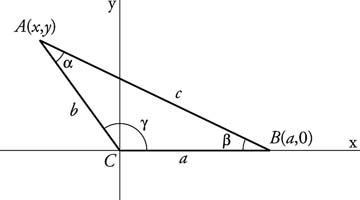
From the figure,
|
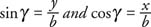
Thus the coordinates of A are
|
Remember, all three forms of the Law of Cosines are true even if γ is acute. Using the distance formula,
|
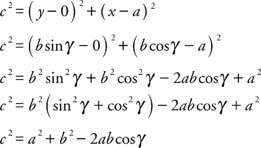
In the preceding formula, if γ is 90°, then the cos 90° = 0, yielding the Pythagorean theorem for right triangles. If the orientation of the triangle is changed to have A or B at the origin, then the other two versions of the Law of Cosines can be obtained.
Two specific cases are of particular importance. First, use the Law of Cosines to solve a triangle if the length of the three sides is known.
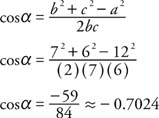
Example 1: If α, β, and γ are the angles of a triangle, and a, b, and c are the lengths of the three sides opposite α, β, and γ, respectively, and a = 12, b = 7, and c = 6, then find the measure of β.
Use the form of the Law of Cosines that uses the angle in question.
|
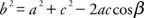
Rewrite solving for cos β.
|
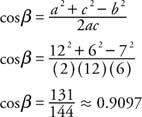
Because cos β > 0 and β < 180°, β < 90° thus,
|

The measure of α can be found in a similar way.
|

Rewrite solving for cos α.
|
Because cos α < 0 and α 180° α > 90° Thus,
|

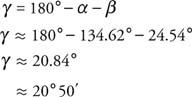
Because the three angles of the triangle must add up to 180°,
|
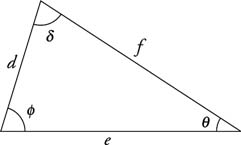
Law of Sines
| |||
| |||
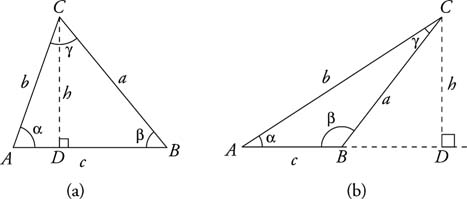
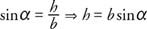
Line segment CD is the altitude in each figure. Therefore Δ ACD and Δ BCD are right triangles. Thus,
|
|
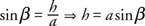
It follows that
|
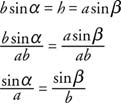
Similarly, if an altitude is drawn from A,
|
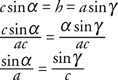
Combining the preceding two results yields what is known as the Law of Sines.
|
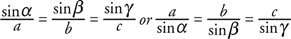
In other words, in any given triangle, the ratio of the length of a side and the sine of the angle opposite that side is a constant. The Law of Sines is valid for obtuse triangles as well as acute and right triangles, because the value of the sine is positive in both the first and second quadrant—that is, for angles less than 180°. You can use this relationship to solve triangles given the length of a side and the measure of two angles, or given the lengths of two sides and one opposite angle. (Remember that the Law of Cosines is used to solve triangles given other configurations of known sides and angles).
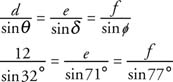
First, consider using the Law of Sines to solve a triangle given two angles and one side.
| |||
| |||
|

|

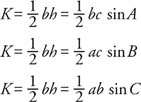
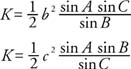
Areas of Triangles
The most common formula for finding the area of a triangle is K = ½ bh, where K is the area of the triangle, b is the base of the triangle, and h is the height. (The letter K is used for the area of the triangle to avoid confusion when using the letter A to name an angle of a triangle.) Three additional categories of area formulas are useful.
wo sides and the included angle (SAS): Given Δ ABC (Figure 1 ), the height is given by h = c sinA. Therefore,
| |||||||||||||||||||||||||||||||||||||||||||||||||||||||||||||||||||||||||||||||||||||||||||||||||||||||||||||||||||||||||||||||||||||||||||||||||||||||||||||||||||||||||||||||||||||||||||||||||||||||||||||||||||||||||||||||||||||||||||||||||||||||||||||||||||||||||||||||||||||||||||||||||||||||||||||||||||||||||||||||||||||||||||||||||||||||||||||||||||||||||||||||||||||||||||||||||||||||||||||||||||||||||||||||||||||||||||||||||||||||||||||||||||||||||||||||
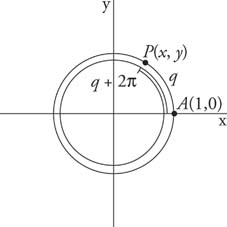
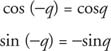
Introduction to GraphsYou can measure angle sizes by using more than one scale. The degree scale is probably the most well-known scale, although the radian scale is equally as popular and useful. Although most applications deal only in one of these two scales, it is important to understand their differences and how to convert from one to the other. You can define trig functions by using a unit circle, a circle with a radius of 1. As a point revolves around the circle, its distance from the x-axis is defined as the sine, and its distance from the y-axis is defined as the cosine. These definitions match the previous definitions in terms of a right triangle. The graphs of trigonometric functions are used to visually represent their behavior. Periodic and Symmetric FunctionsThe unit circle has a circumference of C = 2π r = 2π(1) = 2π. Therefore, if a point P travels around the unit circle for a distance of 2π, it ends up where it started. In other words, for any given value q, if 2π is added or subtracted, the coordinates of point P remain unchanged (Figure 1 ).
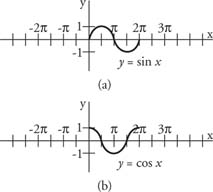
Graphs: Sine and CosineTo see how the sine and cosine functions are graphed, use a calculator, a computer, or a set of trigonometry tables to determine the values of the sine and cosine functions for a number of different degree (or radian) measures (see Table 1 ).
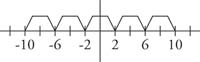
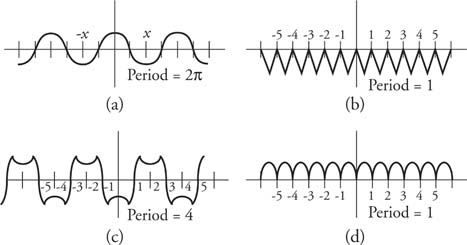
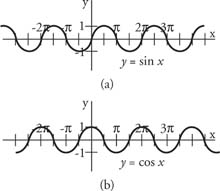
The sine function and the cosine function have periods of 2π; therefore, the patterns illustrated in Figure 1 are repeated to the left and right continuously (Figure 2 ).
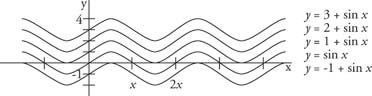
Several additional terms and factors can be added to the sine and cosine functions, which modify their shapes. The additional term A in the function y = A + sin x allows for a vertical shift in the graph of the sine functions. This also holds for the cosine function (Figure 3 ).
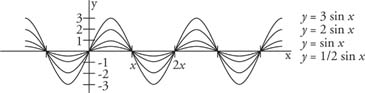
The additional factor B in the function y = B sin x allows for amplitude variation of the sine function. The amplitude, | B |, is the maximum deviation from the x-axis—that is, one half the difference between the maximum and minimum values of the graph. This also holds for the cosine function (Figure 4 ).
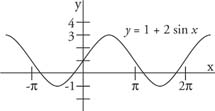
Combining these figures yields the functions y = A + B sin x and also y = A + B cos x. These two functions have minimum and maximum values as defined by the following formulas. The maximum value of the function is M = A + |B|. This maximum value occurs whenever sin x = 1 or cos x = 1. The minimum value of the function is m = A - |B|. This minimum occurs whenever sin x= −1 or cos x = −1. Example 1: Graph the function y = 1 + 2 sin x. What are the maximum and minimum values of the function?
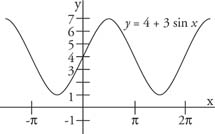
Example 2: Graph the function y = 4 + 3 sin x. What are the maximum and minimum values of the function?
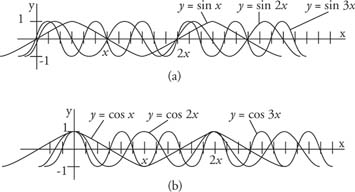
The additional factor C in the function y = sin Cx allows for period variation (length of cycle) of the sine function. (This also holds for the cosine function.) The period of the function y = sin Cxis 2π/|C|. Thus, the function y = sin 5 x has a period of 2π/5. Figure 7 illustrates additional examples.
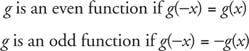
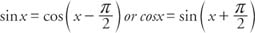
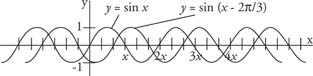
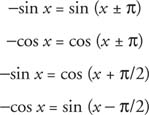
The additional term D in the function y = sin ( x + D) allows for a phase shift (moving the graph to the left or right) in the graph of the sine functions. (This also holds for the cosine function.) The phase shift is | D |. This is a positive number. It does not matter whether the shift is to the left (if D is positive) or to the right (if D is negative). The sine function is odd, and the cosine function is even. The cosine function looks exactly like the sine function, except that it is shifted π/2 units to the left (Figure 8 ). In other words,
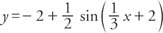
Example 3: What is the amplitude, period, phase shift, maximum, and minimum values of
Example 4: Sketch the graph of y = cosπ x.
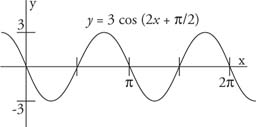
Example 5: Sketch the graph of y = 3 cos (2x + π/2).
The graph of the function y = − f( x) is found by reflecting the graph of the function y = f( x) about the x-axis. Thus, Figure 10 can also represent the graph of y = −3 sin 2 x. Specifically,
It is important to understand the relationships between the sine and cosine functions and how phase shifts can alter their graphs. |


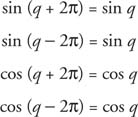

 because the sine function is periodic and has a period of 2π.


|
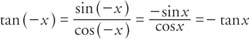
The tangent has a period of π because
|
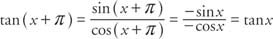
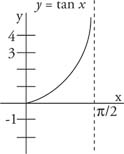
The tangent is undefined whenever cos x = 0. This occurs when x = qπ/2, where q is an odd integer. At these points, the value of the tangent approaches infinity and is undefined. When graphing the tangent, a dashed line is used to show where the value of the tangent is undefined. These lines are called asymptotes. The values of the tangent for various angle sizes are shown in Table 1 .
|


| |||
| |||
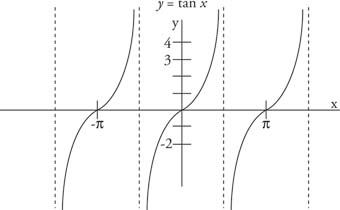
The tangent is an odd function and is symmetric about the origin. The graph of the tangent over several periods is shown in Figure 2 . Note that the asymptotes are shown as dashed lines, and the value of the tangent is undefined at these points.
| |||
| |||
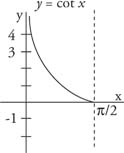
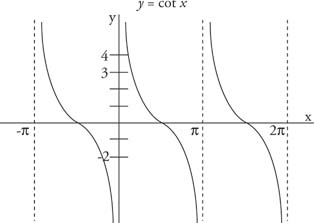
The cotangent is the reciprocal of the tangent, and its graph is shown in Figure 3 . Note the difference between the graph of the tangent and the cotangent in the interval from 0 to π/2.
| |||
| |||
| |||
| |||
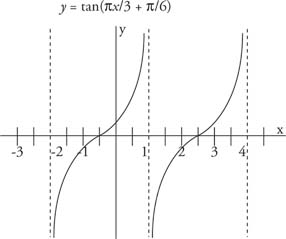
|

|
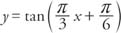
and graph at least two complete periods of the function.
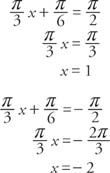
The asymptotes can be found by solving Cx + D = π/2 and Cx + D = −π/2 for X.
|
The period of the function is
|

The phase shift of the function is
|

| |||
| |||
|
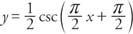
and graph at least two periods of the function.
|

The period of the function is
|

The phase shift of the function is
|

Because the phase shift is positive, it is to the left.
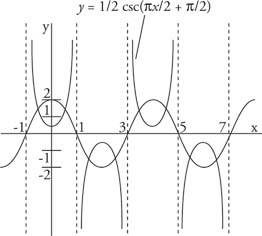
The graph of the reciprocal function
|
is shown in Figure 6 . Graphing the sine (or cosine) can make it easier to graph the cosecant (or secant).
| |||
| |||
Hiç yorum yok:
Yorum Gönder